To do Power BI DAX deduplication based on column or to eliminate the duplicate data from a data set, Power BI has a weapon called DAX. Data Analysis Expressions (DAX) is a library of functions and operators that can be united to create formulas and expressions in Power BI Desktop.
We can deduplicate any data based on a column using a DAX function called DISTINCT Function. In other words, the DISTINCT Function carries out DAX deduplication based on the column.
There are two versions of the DISTINCT Function, DISTINCT (Column) and DISTINCT(table). DISTINCT(table) is used to return a table by removing duplicate rows from another table or expression.
Data Analytics Tricks in Power BI – Guidebook
You too can analyze data like a Data Scientist. No coding needed. No statistics needed.
Analyze & Visualize data using Power BI. (23 tricks in one book)
What Is The Distinct (Column) Function?
The DISTINCT (Column) Function returns a column that contains the discrete values from the specified column. The DISTINCT (Column) Function is mainly used for DAX deduplication based on a column. This means that the duplicate values from a column are eliminated and only unique values are kept.
The DISTINCT (Column) Function falls under the category of the Filter Functions in DAX. The Filter Function in DAX is one of the most complex and important functions.
It is a way different from the Excel Functions. The Lookup Functions in Excel work by using tables and relationships while the Filtering Functions in DAX let you manipulate data context to create dynamic calculations.
What Is The Syntax For Distinct (Column) Function?
The syntax for writing DISTINCT (Column) Function:
DISTINCT(
Where,
Column- It is a column from which unique values are to be returned.
Ex. DISTINCT([ProductPrice])
It returns the unique values from the column ‘ProductPrice’.
What is the Example Of Distinct (Column) Function?
As discussed above, the DISTINCT (Column) Function primarily helps in performing DAX deduplication based on a column. Let’s take an example to understand this concept. We have a data table showing the details of products like product name, product price, etc. as shown in the picture below.
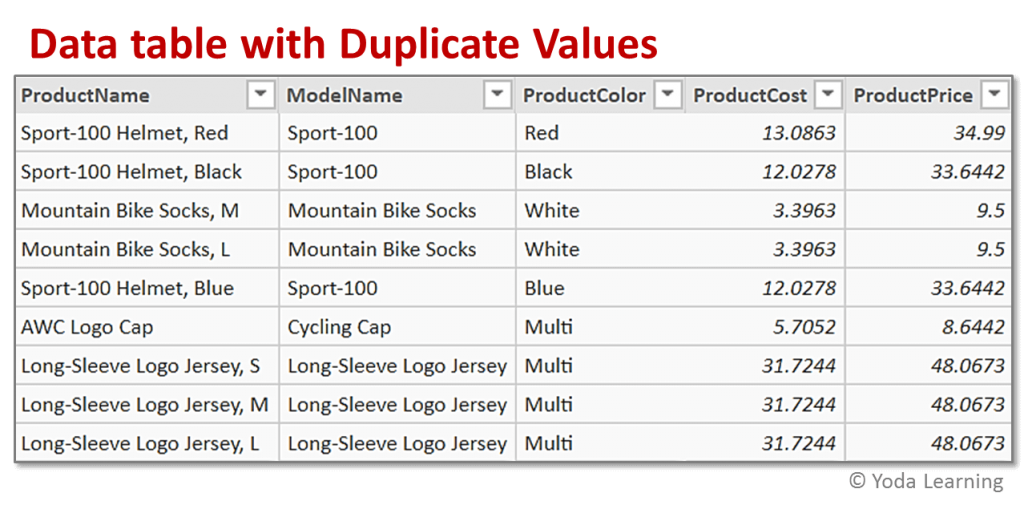
In the Product Color column of the product data, we find some duplicate values. To find the number of actual colors available in products i.e. the distinct colors, we can use the below formula.

All we have to do here is, just create a new measure that will count the distinct values in that column. Here, we have used the COUNTROWS Function along with the DISTINCT Function to first count the total number of rows in the data table. DISTINCT Function will then come into the picture and will return only the number of unique values.
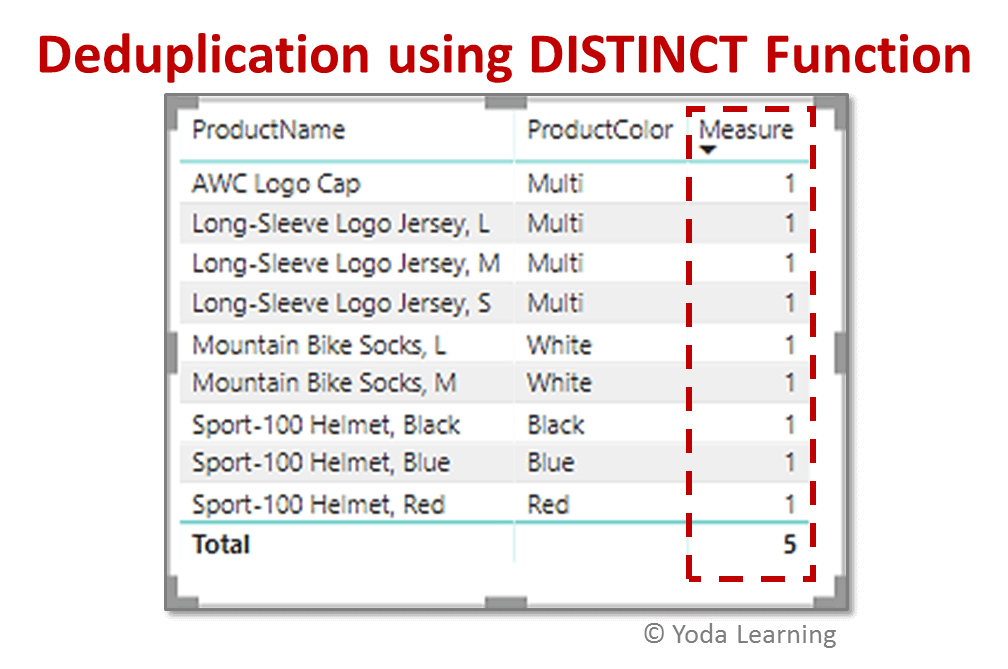
The above image shows the table where the output of the measure returns the value 5. This is because the data table contains the overall 5 colors viz. Multi, Red, Blue, Black, and White color.
Data Analytics Tricks in Power BI – Guidebook
You too can analyze data like a Data Scientist. No coding needed. No statistics needed.
Analyze & Visualize data using Power BI. (23 tricks in one book)
What is the Difference Between Distinct (Column) Function And Distinct (Table) Function?
The major difference between the DISTINCT (COLUMN) FUNCTION and DISTINCT (TABLE) FUNCTION is as follows-
- DISTINCT (COLUMN) FUNCTION returns a column that contains the distinct values from the specified column
- DISTINCT (TABLE) FUNCTION returns a table by removing duplicate rows from another table or expression
- Syntax for DISTINCT (COLUMN) FUNCTION is DISTINCT(
) - Syntax for DISTINCT (TABLE) FUNCTION is DISTINCT(
)
- The column from DISTINCT Function is the one whose unique values are to be returned
- The table from DISTINCT Function is the one whose unique rows are to be returned
- The return value of DISTINCT (COLUMN) FUNCTION is a column of unique values
- The return value of DISTINCT (TABLE) FUNCTION is a table containing only distinct rows
Points To Remember
- The outcomes of the DISTINCT (Column) Function are affected by the current filter setting i.e. if we use the formula to create a measure or column, the results would change whenever the table gets filtered in Power BI
- DISTINCT (Column) Function cannot be used to return the values into a cell or column on a worksheet in Power BI
Conclusion
This is how we can do the DAX deduplication based on a column using the DISTINCT (Column) Function of DAX. We also learned how and where to use this function. I hope you can now use this function without any difficulty.
Related posts
Alteryx Hotkeys - Alteryx Keyboard Shortcuts
2 Mins readTop 50+ Alteryx Shortcuts for Windows. Alteryx is popularly known as a Self-Service Analytics tool. Business users can build their data workflows…Step By Step Guide to Learn Alteryx
6 Mins readAlteryx Learning Path: The growth in technology has resulted in growth in understanding. In today’s world, humans – fellow businessmen know the…VBA Code to Clean the Date Format
1 Mins readWhen it is useful? Most of the time the most annoying problem is when the data is taken from ERP or other…-
Yoda Learning Academy
Learn to [Analyse], [Visualise] and [Automate] using the most commonly used tools in organisations globally i.e. Excel & Power BI.
-
Recent Posts
Navigation
Popular Videos