You may have heard about (or seen) sales dashboard in excel a lot of time. When I was a beginner, I used to wonder how to create a sales dashboard in excel using your actual data. I recently helped one of the students of Excel VBA tutorial on how to build one. This can be really useful if you have a raw data set and you need to present reports to your team on a regular basis.
Based on the data given in Raw Sales Datasheet, you need to create the following 3 Dashboards in excel sheet:
Excel VBA Macros for Non-Coders

Do you find VBA Macros scary? Did you miss any job opportunity because of it? Get started today with our eBook guide on using – Excel VBA Macros. 140 pages of rich visuals. Download now.
Market-wise Sales Dashboard in excel.
This data should be able to filter itself once the client picks one of the Business Segments from the buttons provided on the sheet.
Product-wise analysis dashboard in excel sheet
Where the client can pick one of the product from the drop down and the chart with market wise Sales Amount and Contracted Hours should populate for analysis.
Create quarter-wise dashboard in excel sheet
(Based on Invoice date) of the followings items – Region, Market, Product Description, Business Segment.
There should a button which should say ‘Create Summary’ and then all these sales dashboards gets created on the same excel sheet using VBA code.
How to create a Market wise Sales dashboard in excel?

1. First of all, we have to create a new excel sheet
2. Change the name of the excel sheet as “Market wise Sales Dashboard in excel”.
3. Check how many unique market names are there in Raw Data sheet.
For this, you can apply an Advanced Filter and get only the unique name of the market name and paste it anywhere in the excel sheet you like. I have done the same on the same sheet.
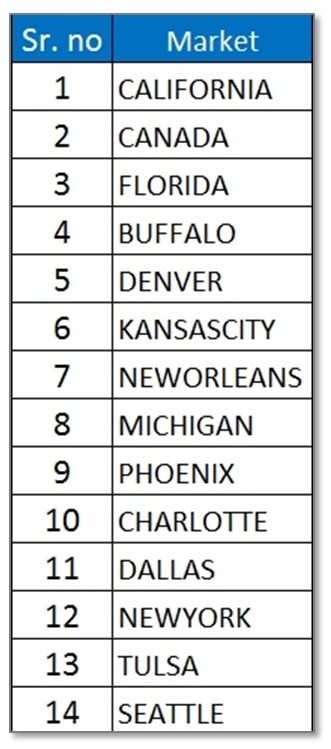
4. Now in the D5 cell, I have created the dummy table and named it as a market. Which I have created using an advanced filter.
5. Now, your table will look like below in Market wise sales Dashboard in excel sheet.
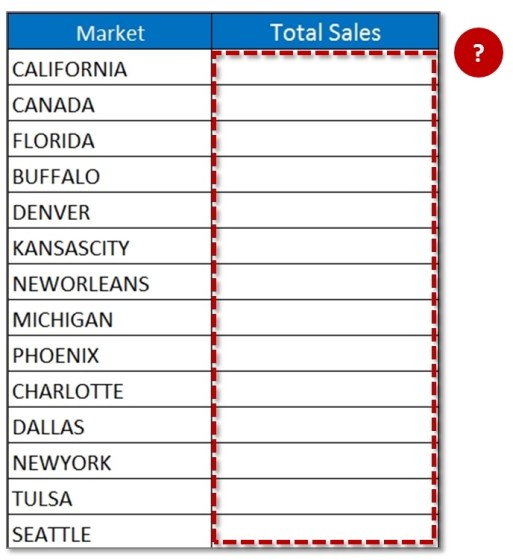
6. If you look very closely at the first problem, it is clearly mentioned over there we need to choose business segment from the drop-down list and the total sales of the market will be changed automatically.
Creating a Combo box for the dashboard in excel
To get the business segment in the drop down we need to create a combo box from Form control and then draw the box and right click on it to format its control.
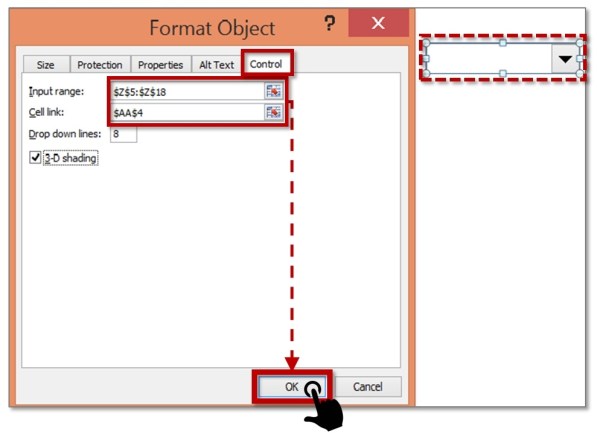
If you select the first value from the box then it will show you 1, for second value 2 and so on… As soon as you format the control then click OK. The format control box will go away, but your combo box will be selected. Click outside and then check whether the value is populated in the box or not.

So, we see that the value is present in the box.
Now the next option is that when I will choose the value from the box the sales dashboard will be populated as per the market (the table we created earlier).
I have arranged in such a way so that it looks good. You may want to try this out too.
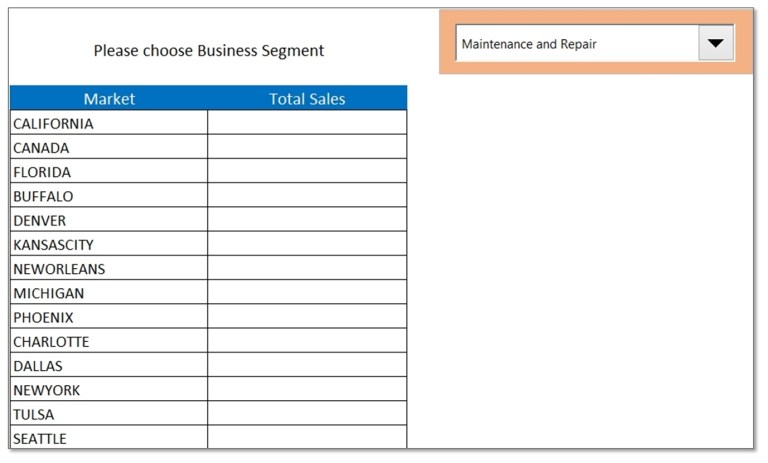
Now it is clear from the above picture that what you are going to do. If you chose the business segment from the drop down it will give you the total sales of that market. If there is simple validation list and we can use sumif function to get the same. But as we are going to use VBA code then we need to write a simple code.
Before we do that, we need to be on the same page conceptually. When I choose the first value from the combo box it will give me 1 in the cell link. However, I will not get the value what is chosen. So I have given a serial number for my business segment and then apply vlookup to get the name. I have tried to illustrate this concept in the picture below.
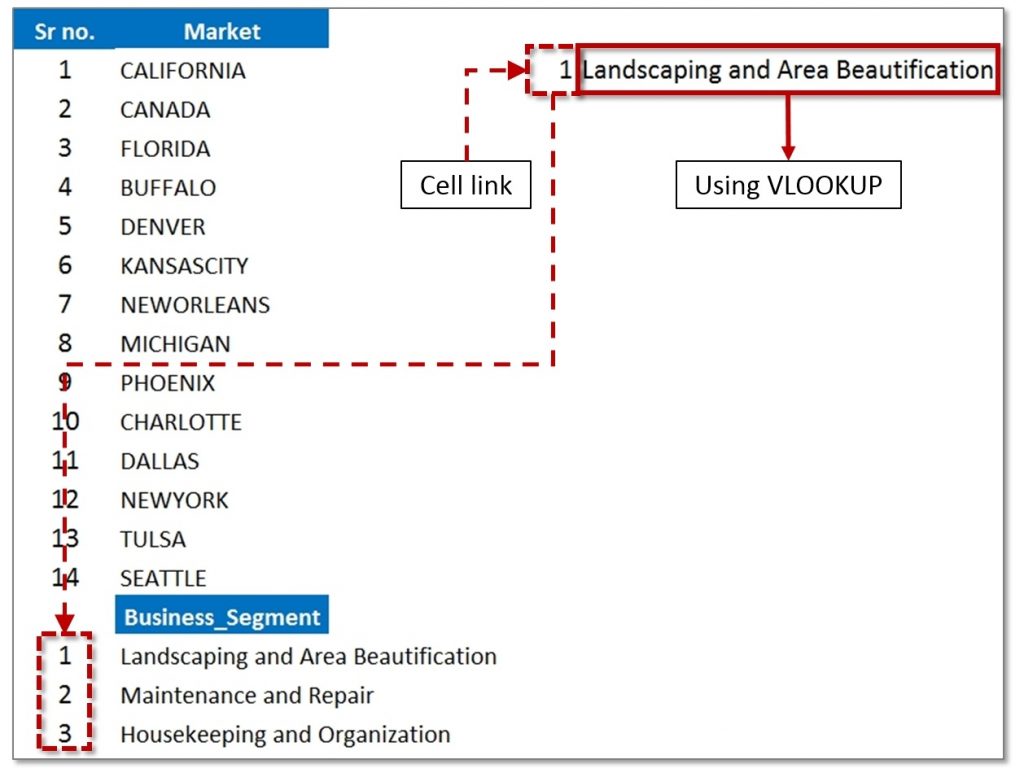
Now you can see from the picture below, to get the name of the business segment I have applied a vlookup formula. So when you will choose the 2nd value from the box then cell link will populate 2 and then a vlookup formula will help you to get the name of the business segment.
Now, We can concentrate on VBA code for a dashboard in excel:
Now I have written a small VBA code. You need to press Alt + F11 and then insert a new module and paste the below VBA code.
Now we need to link this VBA code to the combo box and then we are ready to go. To link the code with the combo box just right click on the box – click on Assign Macro and then choose the name of the macro you have created.
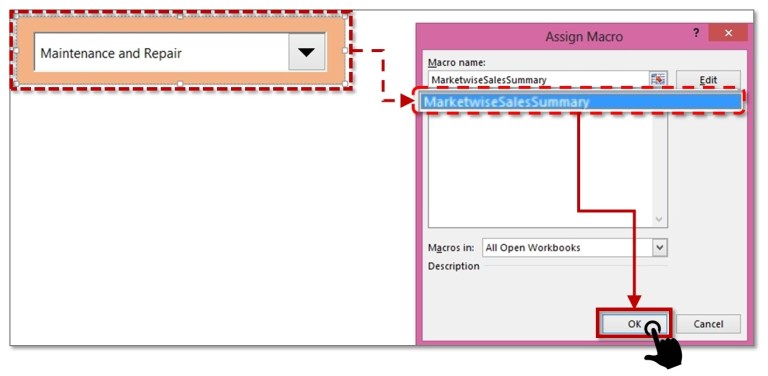
When you choose the right name of the macro then click OK and then click outside to make combo box free. Now you can select the value from the combo box it will populate the sales dashboard of that region and if you change the value then also it will populate the value for the chosen Business segment.
Do you often think that it is almost time to think beyond Excel? It’s time to seek for opportunities and find out the tool which can help you ‘Visualize your Data’. With Excel Dashboard tutorials, you can learn to create Reports and interactive Dashboards in just a few Minutes. We all can’t deny the happiness of Collaborative Analysis and the chance to be involved in embedded Analytics and learning how to create Dynamic Dashboards the right way. If you learn about Dashboards in excel, you’ll learn Visual Analysis i.e. to visually analyse all types of Data and how to create visually rich Dashboards smoothly. So, when you have the chance to level up, why would you miss up on this?
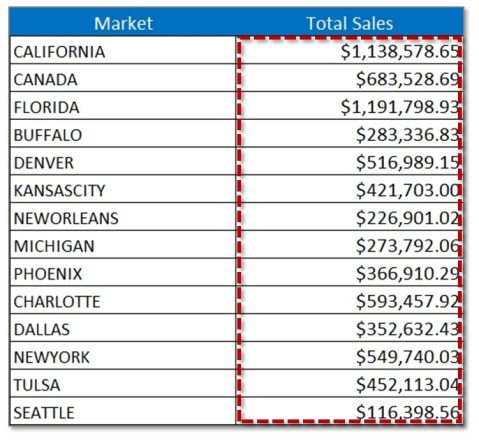
Now you need to create a chart using data populated in your excel sheet. If you choose the business segment from the combo box. You will see that the excel chart is also changing as per the value. Your sheet will look like below.
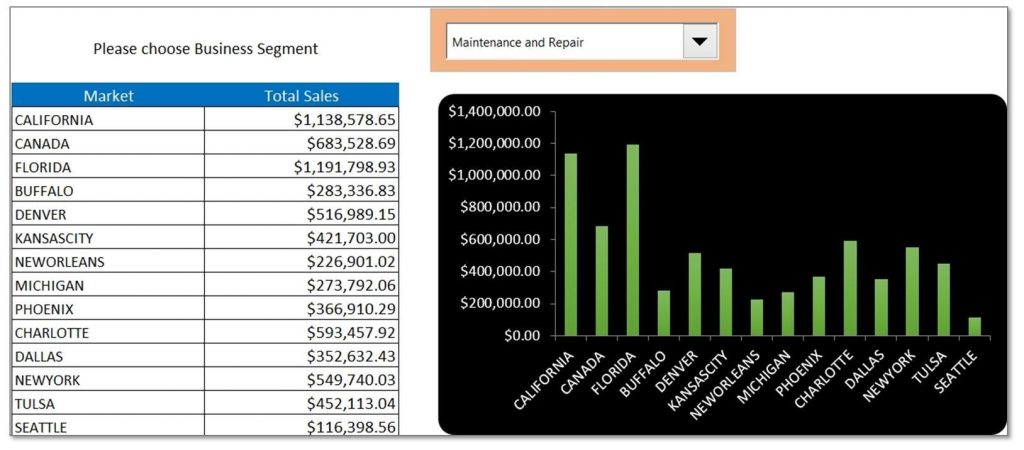
Other two types of dashboard pending – Product-wise dashboard and quarter-wise dashboard. If you’re facing any difficulty, comment here and I will help you out.
Excel VBA Macros for Non-Coders

Do you find VBA Macros scary? Did you miss any job opportunity because of it? Get started today with our eBook guide on using – Excel VBA Macros. 140 pages of rich visuals. Download now.


Hi, I have subscribed this blog. So, would you please provide me Product-wise dashboard and quarter-wise dashboard?
hello,
would you please provide me Product-wise dashboard and quarter-wise dashboard?
would you please provide me Product-wise dashboard and quarter-wise dashboard?
please send answer all three question on excel sheet with excel sheet on email id ; KKOSHAL61@gmaol.com
I have subscribed this blog. Please would you provide me Product-wise dashboard and quarter-wise dashboard. It is really helpful. I will be really grateful to you. Please send me in my email ID.